NYC H&H
Total unreimbursed and uncompensated care cost as a percentage of total operating expenses for all government-owned, major teaching acute-care hospitals.
Purple dot is the median percentage for all hospitals in NYC H&H. In 2016 and 2018, their median appears to be among the outliers on the high side.
The chart below is interactive: click or touch to see more.
![[Chart]](fallback.png)
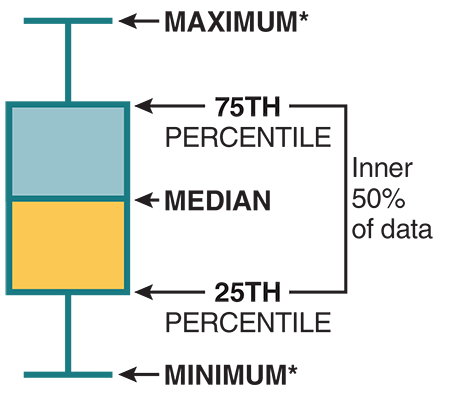
* Data range does not show outliers, which fall beyond the maximum of the range. As there were no outliers below the minimum, data range is cut off at the lower limit of the data for presentation purposes.
Selected stats
Table shows, for each year, the number of reports available, the number of outliers among those reports and the median and average.
Note that all the outliers were on the high side - above the maximum.
NYC H&H consists of 11 cost reports.
| 2013 | 2014 | 2015 | 2016 | 2017 | 2018 | |
|---|---|---|---|---|---|---|
| Number of reports | 79 | 82 | 81 | 83 | 82 | 84 |
| # of outliers | 7 | 4 | 5 | 6 | 5 | 9 |
| Median | 10.43 | 11.74 | 9.09 | 9.72 | 7.9 | 8.61 |
| Average | 16.3 | 15.3 | 15.5 | 17.21 | 15.65 | 15.68 |
| Trimmed average | 12.0 | 12.6 | 12.6 | 13.4 | 12.8 | 10.7 |
| NYC H&H median | 16.18 | 17.23 | 36.71 | 57.82 | 42.07 | 44.06 |
| NYC H&H average | 15.79 | 17.5 | 40.22 | 50.38 | 40.85 | 45.86 |
Notes
Trimmed average is the average excluding outliers.